Earth Science worksheet
    Topic: Velocity Slope Sediment Size Channel Shape Stream Valume Distance From The Sun Gravitational Force Period Of Revolution Speed Of Revolution
    Velocity Slope Sediment Size Channel Shape Stream Valume Distance From The Sun Gravitational Force Period Of Revolution Speed Of Revolution
    1

    The graph below shows changing ocean tide heights in feet (ft) on April 7 for a coastal location.

    seasons-and-astronomy, tides, standard-1-math-and-science-inquery, velocity-slope-sediment-size-channel-shape-stream-valume-distance-from-the-sun-gravitational-force-period-of-revolution-speed-of-revolution fig: esci-v202-exam_g1.png

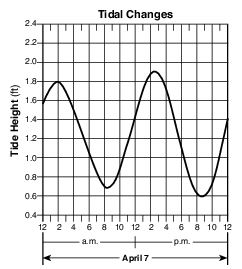
    The next high tide will occur on April 8 at approximately

    (1) 10 a.m.

    (2) 10 p.m.

    (3) 3 a.m.

    (4) 3 p.m.

    2

    Which star type has a surface temperature of4000 K and a luminosity 1000 times greater than

    the Sun?

    (1) dwarf

    (2) main sequence

    (3) giant

    (4) supergiant

    3

    The graph below shows the relationship between the distance that wind blows over a body of water and the height of the waves that are generated.

    reference-tables, planetary-wind-and-moisture-belts-in-the-troposphere, meteorology, weather-basics-and-observable-patterns, standard-1-math-and-science-inquery, velocity-slope-sediment-size-channel-shape-stream-valume-distance-from-the-sun-gravitational-force-period-of-revolution-speed-of-revolution, standard-1-math-and-science-inquery, changing-length-of-a-shadow-based-on-the-motion-of-the-sun, standard-6-interconnectedness, magnitude-and-scale fig: esci-v202-exam_g8.png

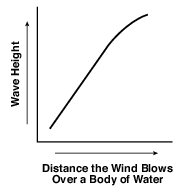
    A west wind blowing with the same velocity would generate the highest waves along the shoreline at

    (1) Jamestown

    (2) Oswego

    (3) Plattsburgh

    (4) Riverhead

    4

    While studying sediments deposited during and after the last ice age, scientists discovered that foraminiferid shells coil in different directions when they grow under different temperature conditions, as shown in the diagram below.

    earth-history, standard-1-math-and-science-inquery, velocity-slope-sediment-size-channel-shape-stream-valume-distance-from-the-sun-gravitational-force-period-of-revolution-speed-of-revolution, standard-6-interconnectedness, models, standard-6-interconnectedness, patterns-of-change fig: esci-v202-exam_g12.png

    Foraminiferid shells found in layer X most likely coiled to the

    (1) right, because water temperatures were cool

    (2) right, because water temperatures were warm

    (3) left, because water temperatures were cool

    (4) left, because water temperatures were warm

    5

    The graph below shows the rate of decay of a radioactive isotope through two half-lives. Each box shows the ratio of atoms of the radioactive isotope to atoms of the disintegration product. The box at two half-lives has been left blank.

    earth-history, earth-history, radioactive-isotopes-dating, standard-1-math-and-science-inquery, velocity-slope-sediment-size-channel-shape-stream-valume-distance-from-the-sun-gravitational-force-period-of-revolution-speed-of-revolution fig: esci-v202-exam_g17.png

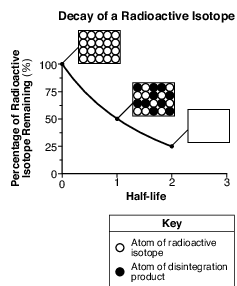
    Which box best represents the ratio of these atoms at two half-lives?

    (1) earth-history, earth-history, radioactive-isotopes-dating, standard-1-math-and-science-inquery, velocity-slope-sediment-size-channel-shape-stream-valume-distance-from-the-sun-gravitational-force-period-of-revolution-speed-of-revolution fig: esci-v202-exam_g13.png

    (2) earth-history, earth-history, radioactive-isotopes-dating, standard-1-math-and-science-inquery, velocity-slope-sediment-size-channel-shape-stream-valume-distance-from-the-sun-gravitational-force-period-of-revolution-speed-of-revolution fig: esci-v202-exam_g14.png

    (3) earth-history, earth-history, radioactive-isotopes-dating, standard-1-math-and-science-inquery, velocity-slope-sediment-size-channel-shape-stream-valume-distance-from-the-sun-gravitational-force-period-of-revolution-speed-of-revolution fig: esci-v202-exam_g15.png

    (4) earth-history, earth-history, radioactive-isotopes-dating, standard-1-math-and-science-inquery, velocity-slope-sediment-size-channel-shape-stream-valume-distance-from-the-sun-gravitational-force-period-of-revolution-speed-of-revolution fig: esci-v202-exam_g16.png

    6

    The first S-wave reaches a seismic station22 minutes after an earthquake occurred. How

    long did it take the first P-wave to reach the same seismic station?

    (1) 8 minutes 50 seconds

    (2) 10 minutes 00 seconds

    (3) 12 minutes 00 seconds

    (4) 12 minutes 50 seconds

    7

    What is the minimum stream velocity necessary to transport a quartz particle that is 0.1 centimeter in diameter in a stream?

    (1) 0.05 cm/s

    (2) 0.5 cm/s

    (3) 5.0 cm/s

    (4) 50.0 cm/s

    Base your answers to questions 8 on the diagram below and on your knowledge of Earth science. The diagram represents the elliptical orbit for one planet in our solar system. The two foci of the orbit are shown as the Sun and F2.

    seasons-and-astronomy, the-solar-system, standard-1-math-and-science-inquery, velocity-slope-sediment-size-channel-shape-stream-valume-distance-from-the-sun-gravitational-force-period-of-revolution-speed-of-revolution, standard-6-interconnectedness, models fig: esci-v202-exam_g30.png

    8

    Which condition would produce an orbit with a greater eccentricity?

    (1) a decrease in the distance between the Sun and F2

    (2) an increase in the distance between the Sun and F2

    (3) a constant decrease in the orbital velocity of the planet

    (4) a constant increase in the orbital velocity of the planet

    Base your answers to questions 9 on the passage below and on your knowledge of Earth science.

    Waimea Canyon

    Waimea Canyon is located on the west side of the island of Kauai, Hawaii. Waimea Canyon has been referred to as the “Grand Canyon of the Pacific.” But unlike the Grand Canyon, which was carved through horizontal layers of sedimentary rocks, Waimea Canyon was cut through basalt. The formation of this igneous rock began about 4 million years ago. Numerous lava flows followed as magma rose from deep within Earth. The canyon then was formed over time by erosional agents, causing deep, V-shaped valleys that exposed the basalt layers along the canyon walls.

    Over time, the composition of the basalt, where it was exposed at the surface, was changed due to oxidation (rusting) of iron-bearing minerals, such as pyroxene and olivine. The result is a canyon with red rocks and soils.

    9

    Identify the epoch during which the first basalt lava flows occurred on Kauai. [1]

    Epoch

    Allow 1 credit for Pliocene Epoch.

    Base your answers to questions 10 on the map in image provided, on the table below, and on your knowledge of Earth science. The map shows a portion of the Nazca Plate under the southeastern Pacific Ocean. Plate A represents another tectonic plate. The table shows some data for islands and seamounts (undersea volcanoes that do not rise above the ocean surface) that originally formed at the Easter Island Hot Spot.

    dynamic-earth, earth-surface-features, landscapes, standard-1-math-and-science-inquery, eccentricity-rate-gradient-standard-error, standard-6-interconnectedness, models fig: esci-v202-exam_g44.png

    10

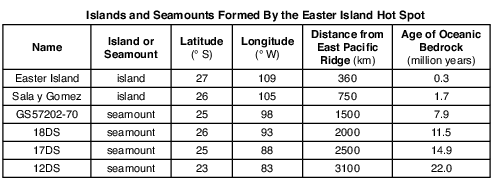
    Describe the general relationship between the distance from the East Pacific Ridge and the age of the oceanic bedrock of the islands and seamounts. [1]

    Allow 1 credit. Acceptable responses include, but are not limited to:

    • — As distance from the East Pacific Ridge increases, the age of the bedrock of the islands and

    • seamounts increases.

    • — The farther from the ridge, the older the bedrock.

    • — Younger bedrock is closer to the ridge.

    • — direct relationship

    Base your answers to questions 11 on the weather map below and on your knowledge of Earth science. The map shows the location of a low-pressure system over New York State during late summer. Isobar values are recorded in millibars. Shading indicates regions receiving precipitation. The air masses are labeled. Eight locations in New York State are indicated.

    meteorology, weather-variables, meteorology, weather-basics-and-observable-patterns, meteorology, weather-variables, standard-6-interconnectedness, systems-thinking, standard-6-interconnectedness, models fig: esci-v202-exam_g46.png

    11

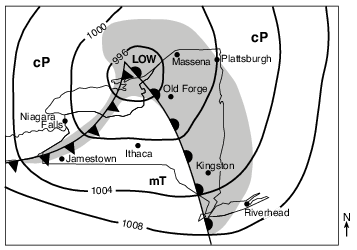
    Convert the air pressure at Plattsburgh, New York, from millibars to inches of mercury. [1]

    in of Hg

    Allow 1 credit for any value from 29.52 to 29.53 in of Hg.

    Base your answers to questions 12 on the diagram below and on your knowledge of Earth science. The diagram represents the inferred sequence in which our solar system formed from a nebula of gas and dust. Letters A through F represent different stages in its development.

    seasons-and-astronomy, stars, standard-1-math-and-science-inquery, geocentric-model-heliocentric-model, standard-6-interconnectedness, models fig: esci-v202-exam_g49.png

    12

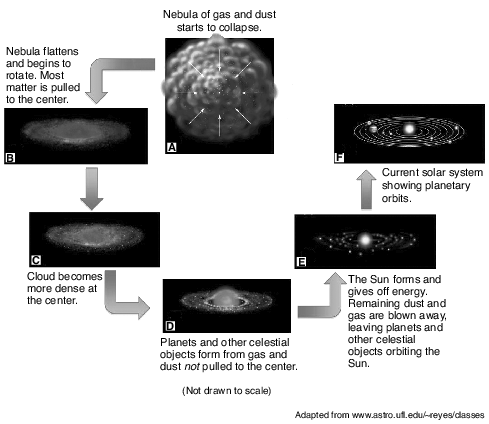
    Most asteroids formed in a belt located between 329 million and 478.7 million kilometers from the Sun. Identify the two planets located on either side of the asteroid belt. [1]

    ________________________________ and _________________________________

    Allow 1 credit for Mars and Jupiter.

    Base your answers to questions 13 on the map below and on your knowledge of Earth science. The map shows the four time zones across the continental United States. Eight cities are labeled on the map.

    seasons-and-astronomy, earth-rotation, standard-1-math-and-science-inquery, velocity-slope-sediment-size-channel-shape-stream-valume-distance-from-the-sun-gravitational-force-period-of-revolution-speed-of-revolution, standard-6-interconnectedness, models, standard-6-interconnectedness, patterns-of-change fig: esci-v202-exam_g50.png

    13

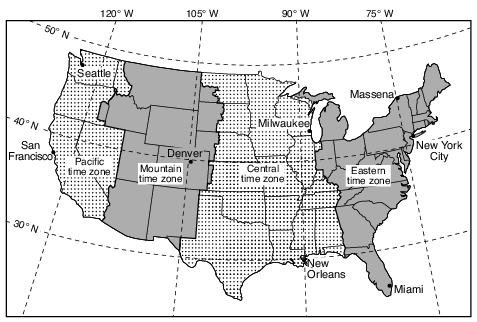
    State the time at San Francisco, California, when it is 12 noon at New Orleans, Louisiana. Indicate a.m. or p.m. in your answer. [1]

    Allow 1 credit. Acceptable responses include, but are not limited to:

    • — 10:00 a.m.

    • — 10 am

    • — 1000 (military time)

    • — 10 in the morning

    Base your answers to questions 14 on the graphs below and on your knowledge of Earth science. The climate graphs represent data for three different locations in North America. Line graphs show the average monthly air temperatures in degrees Fahrenheit (°F). Bar graphs show the average monthly precipitation in inches (in). A circled dot (⊙ ) indicates each location on the maps.

    reference-tables, specific-heats-of-common-materials, insolation-and-the-seasons, variations-of-insolation, climate, climate-of-a-location, meteorology, weather-and-specific-heat-of-materials, standard-1-math-and-science-inquery, geocentric-model-heliocentric-model, standard-1-math-and-science-inquery, changing-length-of-a-shadow-based-on-the-motion-of-the-sun, standard-6-interconnectedness, models fig: esci-v202-exam_g51.png

    14

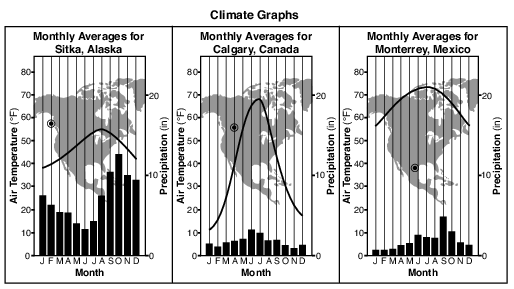
    Identify the most likely types of precipitation that occur in Calgary, Canada, and Monterrey, Mexico, during January and February. [1]

    Type of precipitation in Calgary: Type of precipitation in Monterrey:

    Allow 1 credit if both responses are correct. Acceptable responses include, but are not limited to:

    • Type of precipitation in Calgary:

    • — snow/snow showers

    • — sleet

    • — freezing rain

    • Type of precipitation in Monterrey:

    • — rain/rain showers

    • — drizzle

    • Note: Do not allow credit for “hail” as the type of precipitation in either Calgary or Monterrey

    • because this is not the most likely type of precipitation that occurs at these locations.. Do not allow credit for “thunderstorms” as the type of precipitation in Monterrey because this does not identify the type of precipitation but a meteorological event.

    Base your answers to questions 15 on the data table below, which shows the air temperature, in degrees Fahrenheit, and air pressure, in inches of mercury (Hg), recorded at a weather station in New York State from 11 a.m. to 7 p.m. on a day in September.

    meteorology, presentation-of-weather-data, standard-1-math-and-science-inquery, velocity-slope-sediment-size-channel-shape-stream-valume-distance-from-the-sun-gravitational-force-period-of-revolution-speed-of-revolution, standard-1-math-and-science-inquery, use-isolines-to-determine-a-source-of-pollution fig: esci12012-examw_g36.png

    15

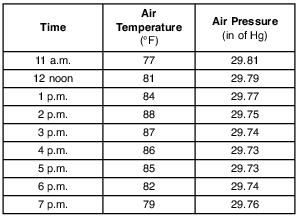
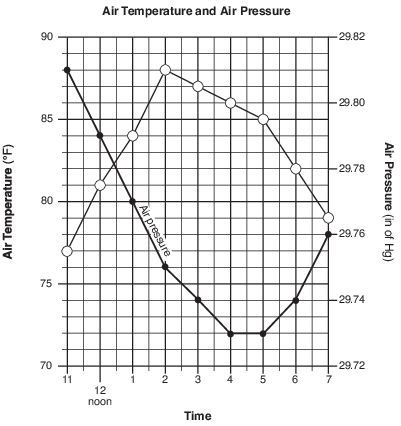
    On the grid in the image provided, construct a line graph by plotting the data for the air temperature for each time from 11 a.m. to 7 p.m. Connect the plots with a line. The data for air pressure have been plotted. [1]

    meteorology, presentation-of-weather-data, standard-1-math-and-science-inquery, velocity-slope-sediment-size-channel-shape-stream-valume-distance-from-the-sun-gravitational-force-period-of-revolution-speed-of-revolution, standard-1-math-and-science-inquery, use-isolines-to-determine-a-source-of-pollution fig: esci-ansbklt112w_abkq2.png

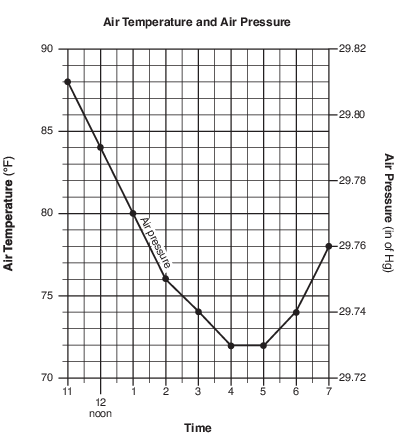
    Allow 1 credit if the centers of all nine plots are within the circles shown and are correctly connected with a line that passes within each circle.

    • Note: It is recommended that an overlay of the same scale as the student answer booklet be used

    • to ensure reliability in rating.

    meteorology, presentation-of-weather-data, standard-1-math-and-science-inquery, velocity-slope-sediment-size-channel-shape-stream-valume-distance-from-the-sun-gravitational-force-period-of-revolution-speed-of-revolution, standard-1-math-and-science-inquery, use-isolines-to-determine-a-source-of-pollution fig: esci12012-rg_g2.png